The Nature of Prop Firm Challenges: Turning Uncertainty into Statistical Confidence
In short
- A single pass or fail is mostly luck. What you actually want to know is how often your strategy passes across thousands of attempts.
- A Monte Carlo simulation replays your strategy thousands of times against a firm's real rules to reveal your true pass rate.
- Passing is as much about never touching the drawdown floor or the daily limit as it is about reaching the profit target.
- Low variance, right-sized risk, and a low risk of ruin matter more for passing than raw profitability.
- Because of path-dependency, the order of your wins and losses can pass or fail two identical strategies. Test yours free in the simulator.
If you have ever taken a prop firm evaluation, you already know the feeling. You have a decent strategy, a bit of discipline, and a set of rules you have to respect. But no matter how good the plan looks on paper, the outcome still feels like a coin flip. Sometimes you pass comfortably. Sometimes the exact same approach blows the account on a bad run of luck. This guide explains a tool that helps you understand why that happens, and how to think about it: the Monte Carlo simulation.
It is written to be understandable even if you have never touched statistics. No formulas are required to get the point. By the end you will know what a Monte Carlo simulation does, who uses it, why it is genuinely useful for passing a challenge, and what actually separates a strategy that survives an evaluation from one that does not. This is educational material only. It is not trading advice, and it does not tell you what or how to trade.
What a Monte Carlo simulation actually does
A Monte Carlo simulation is a way of answering the question "what could happen?" by letting a computer play out the future thousands of times instead of just once. The name comes from the famous casino city, because the whole idea is built around chance.
Think about it like this. Real life only gives you one version of events. You take your trades, the market does what it does, and you end up with a single result. But that single result is just one path out of a huge number of paths that could have happened. A slightly different order of wins and losses, a slightly different day, and the story ends somewhere else entirely.
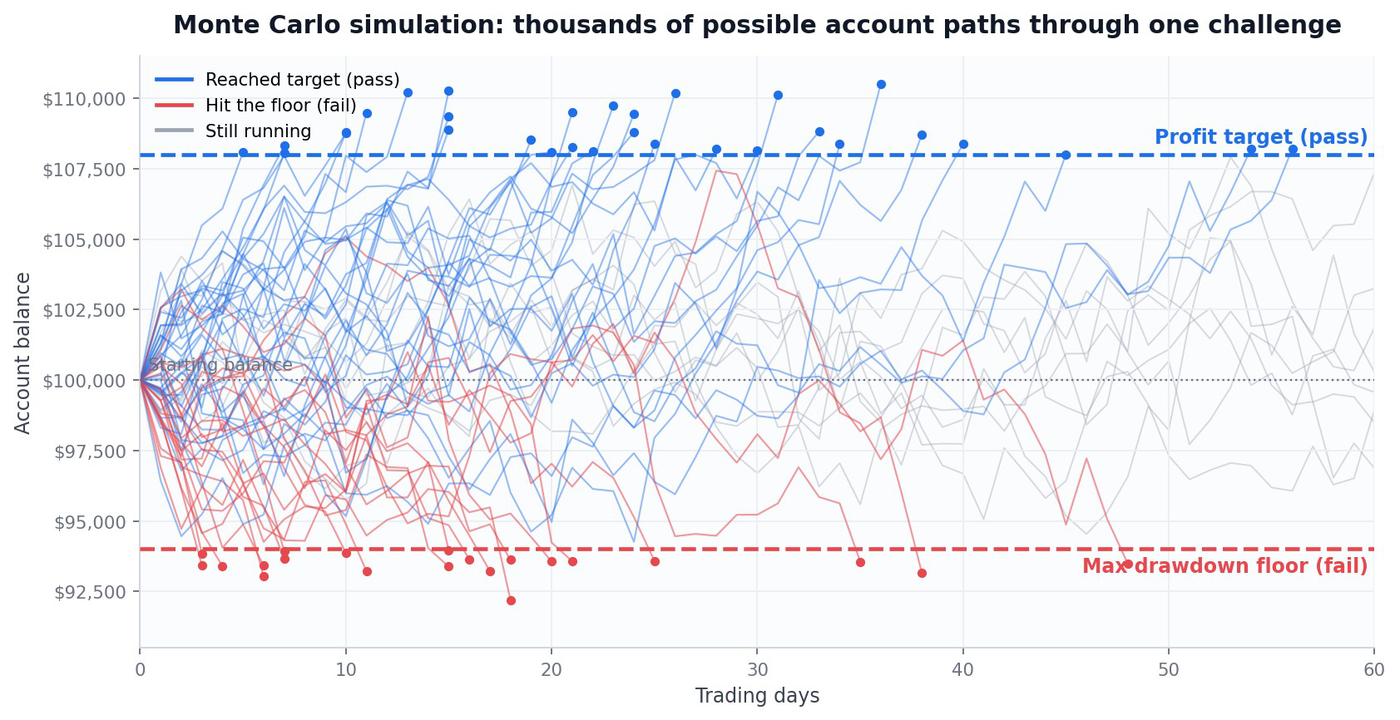
A Monte Carlo simulation rebuilds that idea inside a computer. You give it the ingredients of your approach, things like how often you win, how big your typical win is, how big your typical loss is, and how much you risk per trade. Then the computer deals out those trades in random orders, over and over, generating thousands of alternative histories. Each run is one possible "life" your account could have lived. When you stack all of those lives on top of each other, you stop seeing a single lucky or unlucky story and start seeing the full range of what your approach tends to produce.
The result is not a prediction of one exact future. It is a map of possibilities. It tells you things like: in most of these thousands of runs the account grew, in some it stalled, and in a certain slice of them it hit a limit and failed. That distribution, the spread of good, average, and bad outcomes, is the real output, and it is far more honest than any single backtest.
Who uses Monte Carlo simulations, and why
Monte Carlo methods are not a trading gimmick. They are a serious, decades-old technique used anywhere people have to make decisions under uncertainty. A few examples make the idea concrete:
- Engineers and scientists use them to test whether a bridge, a rocket, or a nuclear reactor will hold up across every plausible combination of stresses, not just the average case.
- Insurance companies run them to estimate how many claims they might face in a bad year, so they can stay solvent when many things go wrong at once.
- Retirement and financial planners use them to answer "will this savings plan last thirty years?" across thousands of possible market futures.
- Project managers use them to estimate realistic delivery dates instead of a single optimistic guess.
The common thread is uncertainty. Whenever the future is driven partly by luck and partly by your choices, a single best guess is misleading. What decision-makers really want to know is the range of outcomes and the odds of the bad ones. Monte Carlo simulation is the standard way to get that answer, which is exactly why it translates so well to trading evaluations.
Why this matters for a prop firm challenge
A prop firm challenge is, at its heart, a survival test with a scoreboard. You are usually asked to reach a profit target without breaking any of the firm's risk rules along the way. Two traders can use an identical strategy and get opposite results purely because of the order in which their wins and losses arrived. One hits a rough patch early, trips a drawdown limit, and fails. The other hits the same rough patch later, after building a cushion, and sails through.
This is the trap of judging a strategy by a single attempt. Passing once does not prove a strategy is good, and failing once does not prove it is bad. What you actually want to know is: if I ran this exact approach a thousand times under these exact rules, how often would it pass? That is precisely the question a Monte Carlo simulation is built to answer.
By simulating thousands of attempts, you get an estimate of your real pass rate rather than a single anecdote. You can see whether your approach passes 8 times out of 10 or barely 3 times out of 10. You can see whether failure usually comes from the daily limit or the overall limit. And you can test how changing one thing, say, risking less per trade, shifts the whole distribution. It turns "I think this might work" into "here is how often this tends to work, and here is what usually kills it."
The "borders" in a simulation: your challenge rules
A good prop firm simulation does not just track a number going up and down. It draws borders around that number, invisible walls that represent the firm's rules. Each simulated account moves inside these walls, and the moment it touches the wrong one, that run ends. These borders are what make a prop firm simulation different from a generic one. They are the rules of the game, drawn onto the map.
The most common borders are:
- The profit target (the finish line). This is the top border in a positive sense, the level the account has to reach to pass. A run that touches this line is a success.
- The maximum drawdown (the floor). This is the hard bottom. If the account falls below this level at any point, the run is over. In the simulation it is the wall that ends the most attempts, because it does not care how good your average day is, one deep enough valley and you are out.
- The daily loss limit (a moving trap door). Many firms cap how much you can lose in a single day. In a simulation this resets each day, which means a strategy that is calm on average but occasionally has one violent day can still fail here even while staying above the overall floor.
- Time or consistency conditions. Some challenges add a minimum number of trading days, or rules that stop a single lucky day from carrying the whole account. These act as side rails that shape which winning paths actually count.
When you watch thousands of simulated accounts move between these borders, something clicks. You see that passing is not only about pushing toward the profit target. It is just as much about never touching the floor or the trap door on the way there. The simulation makes those walls visible, and it shows you which one is most likely to end your particular approach.
What makes a strong prop firm strategy
Once you can see the full distribution of outcomes, the qualities that help you pass a challenge look different from what most people expect. The goal is not the flashiest returns. It is reaching the finish line while staying inside the walls as reliably as possible. Three characteristics matter most.
1. Low variance
Variance is just a measure of how wildly your results swing from one trade or day to the next. A high-variance approach has big ups and big downs; a low-variance approach grinds in a steadier, narrower band. For a normal account, high variance is uncomfortable but survivable. For a challenge with a hard drawdown floor, high variance is dangerous, because every large swing is another roll of the dice against that wall.
In a Monte Carlo simulation this shows up clearly. Take two approaches with the same average result, but give one of them wilder swings. The wilder one will fail far more often, because more of its thousands of paths dip low enough to hit the floor before reaching the target. Lower variance keeps more paths safely between the borders, which is why steadiness tends to pass more consistently than raw firepower.
2. Optimal risk sizing
How much you put at stake on each trade may be the single biggest lever over your pass rate, and it works in a way that surprises people. Risking more does raise the size of your wins, but it raises the size of your losses just as much, and it pulls every path closer to the drawdown floor. Push size too high and even a genuinely good approach starts failing often, simply because its normal losing streaks now reach the wall.
There is usually a sweet spot: large enough to reach the profit target in a reasonable time, but small enough that ordinary losing streaks do not end the run. Below that spot you are too slow and risk running out of time; above it you are too fragile. A simulation lets you slide risk up and down and watch the pass rate rise, peak, and then collapse, revealing where that balance sits for your specific numbers instead of leaving it to guesswork.
3. Understanding risk of ruin
"Risk of ruin" is the chance that a string of losses ends the account before anything good can happen. It is the number the drawdown floor is really testing. Even an approach with a genuine long-term edge carries some risk of ruin on any single attempt, because losing streaks are a normal part of any process driven partly by chance. A simulation puts an actual figure on that risk for your settings, so you can see how often the floor ends your run before the target is reached.
Why profitability alone does not decide the outcome
This is the idea that trips up the most people, so it is worth stating plainly: a strategy can be profitable on average and still fail a challenge, and a strategy that is only modestly profitable can pass comfortably. The reason is something called path-dependency.
Path-dependency means the order of events changes the outcome, even when the final total is identical. Imagine two accounts that end a stretch with the exact same net profit. The first one drifted gently upward the whole way. The second earned all of its profit at the end, but only after a brutal losing streak at the start. On a normal account both look the same at the finish. In a challenge they are worlds apart, because the second account may have smashed through the drawdown floor during that early streak and been eliminated long before its profit ever arrived. The total was fine; the path was fatal.
This is why "is it profitable?" is the wrong first question for a challenge. The right question is "what do its paths look like, and how many of them stay inside the walls long enough to reach the target?" A modestly profitable approach with smooth, low-variance paths and sensible risk can pass a large share of the time. A more profitable but violent approach can fail more often, because too many of its paths hit a wall before the good part arrives. Profitability is necessary for long-term success, but on any single evaluation, the shape and order of the journey, the path, is what actually decides whether you pass.
A Monte Carlo simulation is the clearest way to see this for yourself. It does not hide the ugly paths behind a comforting average. It shows you the whole crowd of possible journeys at once, so you can judge an approach by how it behaves across all of them, not by the one story that happened to play out.
See it for yourself, for free
The rules for every major prop firm are already built in, the profit targets, the drawdowns, the daily limits. Pick your firm, enter your strategy's stats, and watch thousands of simulated attempts reveal your real odds of passing.
Open the free simulator →Compare prop firms side by side, find the one that fits your strategy, and grab their current discounts.
Compare firms and get discounts →This post is for educational purposes only. It explains a statistical tool and general concepts around prop firm evaluations. It is not financial or trading advice, not a recommendation to trade or to buy any challenge, and it makes no promise about results. A simulation is a model built on the numbers you give it, the real world can and will behave differently. Always make your own decisions and understand the risks involved.
This post contains affiliate links. If you sign up through them, I may earn a commission at no extra cost to you.
← All blogs